Data-driven retraining with production observability insights

We all know that our model’s best day in production will be its first day in production. It’s simply a fact of life that, over time, model performance degrades. ML attempts to predict real-world behavior based on observed patterns it has trained on and learned. But the real world is dynamic and always in motion; sooner or later, depending on your use case and data velocity, your model will decay and begin to exhibit concept drift, data drift, or even both. 

Your best day in production is your first day in production

When models misbehave, we often turn to retraining to attempt to fix the problem. As a rule of thumb, data science teams will often take the most recent data from production, say 2 or 3 months’ worth of data, and retrain their model on it with the assumption that “refreshing” the model’s training observations will enable it to predict future results better. But is the most recent data the best data to resolve a model’s performance issues and get it back on track? Think about it this way, if an end-to-end software test failed would you accept it as fixed just by rerunning the test? Most likely not. You’d troubleshoot the issue to pinpoint the root cause and apply an exact fix to resolve the issue. ML teams do precisely this with model monitoring to pinpoint anomalies and uncover their root cause to resolve issues quickly before they impact business outcomes. But when the resolution requires retraining, “fresh is best” is not exactly a data-driven approach.

This article will demonstrate how data science and ML engineering teams can leverage ML monitoring to find the best data and retraining strategy mix to resolve machine learning performance issues. This data-driven, production-first approach enables more thoughtful retraining selections and shorter and leaner retraining cycles and can be integrated into MLOps CI/CD pipelines for continuous model retraining upon anomaly detection.

Matching production insights to retraining strategies

The insights explained below are based on anomalies detected in the Superwise model observability platform and analyzed in a corresponding jupyter notebook that extracts retraining insights. All the assets are open for use under the Superwise community edition, and you can use it to run the notebook on your own data. 

* It’s important to note that the value of this approach lies in identifying how to best retrain once you have eliminated other possible issues in your root cause investigation. 

Identifying retraining groups 

The question? What data should I use for the next retraining?

Models are subject to temporality and seasonality. Selecting a dataset impacted by a temporal anomaly or flux can result in model skew. An important insight from production data is data DNA or the similarity of days distribution. Understanding how data is changing between dates (drift score between dates) enables date-based grouping based on similarities and differences. With this information, you can create a combination of data-retraining groups that reflect or exclude the temporal behavior of your production data. 

Here we can see a heatmap plot matrix of dates X dates, and each cell represents the change between 2 dates. Cells colored in bold are very different from each other, while cells that are colored lightly represent dates that are very similar to each other.

Identifying retraining groups
Data DNA

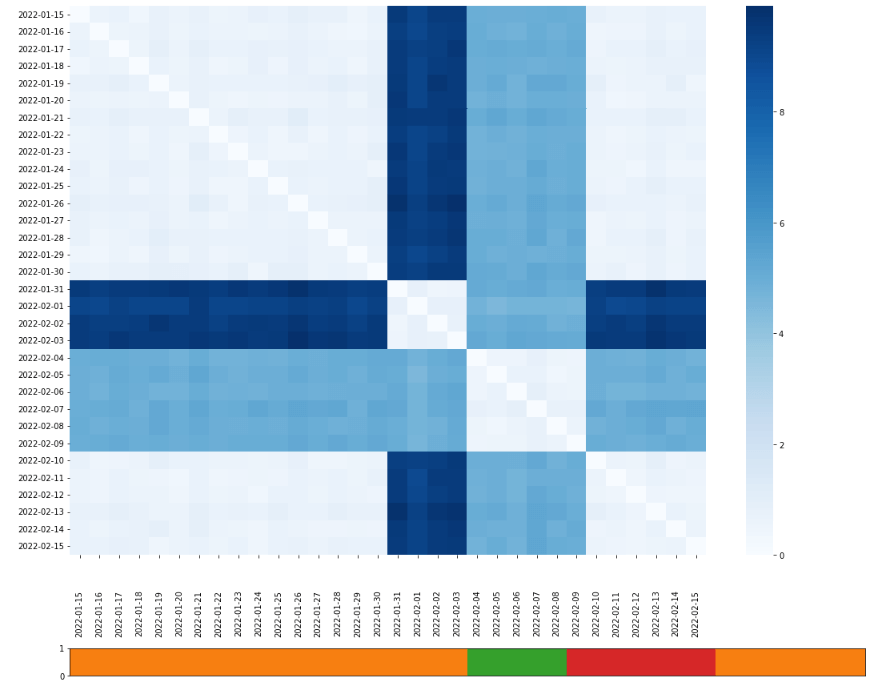
As you can see in this example, the data is divided into 3 main groups, orange, red, and green, representing the 3 optional datasets to use in the next retraining.

  • Red – the red group reflects a recurring event in our data that we want to train on. This could be, for example, behavior over the weekends. 
  • Orange – the orange group is normal data behavior in production.
  • Green – the green group represents a unique behavioral event. For example, this could be a marketing campaign in a click-through rate optimization use case. 

Depending on your domain insights, the include/exclude decisions may differ. If the marketing campaign was successful and the insights will be rolled-out to all marketing campaigns, you may decide to retrain green and red. If the campaign was a one-time event or a failed experiment, orange and red would be a better retraining data group selection. 

Retraining groups
Retraining groups

Identifying drifted segments

The question? Which populations are impacted?

A model’s purpose is to abstract predictions across your population, but with that said, you will always need to monitor your model’s behavior on the segment level to detect if a specific segment is drifting. When segment drift is detected, we can consider the following resolutions or even a combination of them, together with retraining. 

  • Model split – create a specific model for the segment.
  • Optimize the model – suit the model to handle the current segment.
  • Resample the data – change the data distribution that the model will learn on data for the specific model.

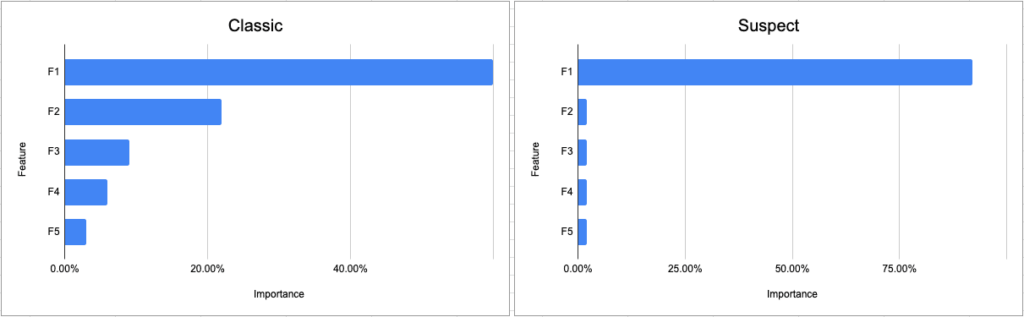
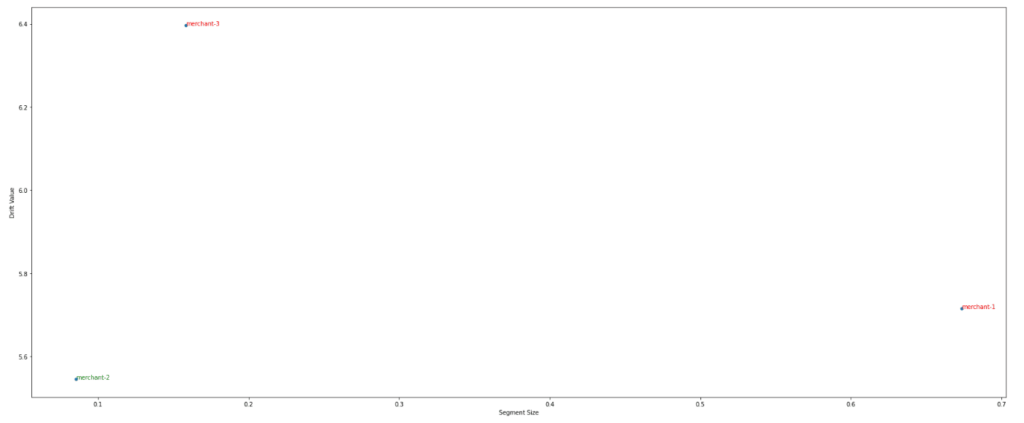
Here we can see the segment drift value where each bar shows the drift score of each segment. Before taking action, it is important to understand the relationship of the segment size to the segment drift to determine the extent of the segment’s effect on the model.

Mean segment drift
Mean segment drift

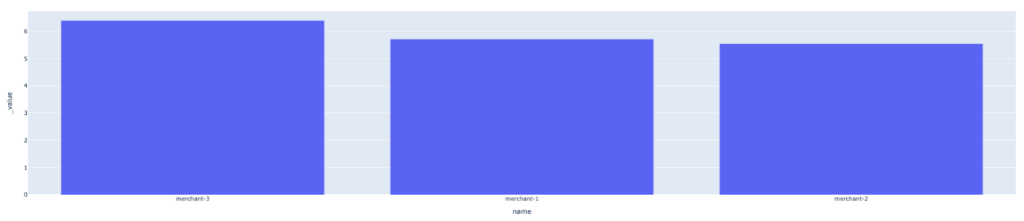
Moreover, this lets us see the relation of segment size to the segment drift value and determine if we need to create a specific model for this segment or not.

Relationship between segment size and segment drift

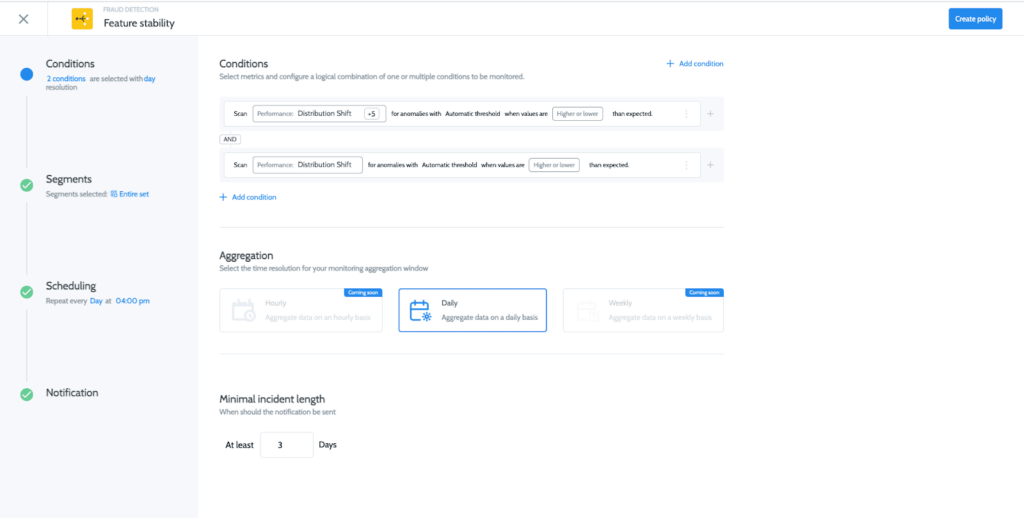
Identifying days with integrity issues

The question? Which days should be excluded from retraining on principle?

Some data should be excluded from retraining on principle, namely days when we experienced data integrity issues due to some pipeline or upstream source issue. If this data is taken into consideration during retraining, it can cause our model to misinterpret the ‘normal’ distribution, which can result in a further decline in model performance. 

Top 10 day's with integrity incidents
Top 10 days with integrity incidents

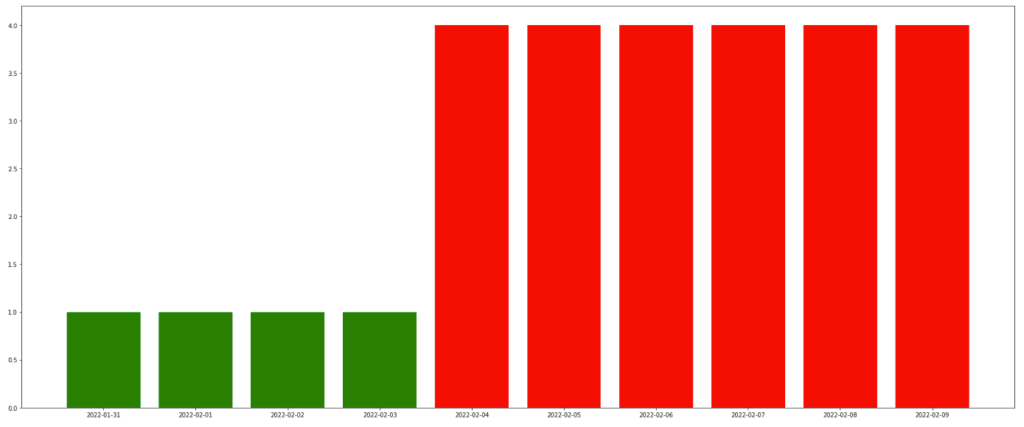
Here we can see a bar graph of the days with data integrity incidents. This lets us quickly identify ‘bad’ data that we should exclude from the next retraining.

Smarter, leaner retraining

Retraining isn’t free. It takes up resources both in terms of training runs and your team’s focus and efforts. So anything that we can do to improve the probability of finishing a retraining cycle with higher-performing results is crucial. That is the value of data-driven retraining with production insights. Smarter and leaner retraining that leverages model observability to take you from detection quickly and effectively. 

Ready to get started with Superwise?

Head over to the Superwise platform and get started with easy, customizable, scalable, and secure model observability for free with our community edition.

Prefer a demo?

Request a demo and our team will show what Superwise can do for your ML and business. 

5 ways to prevent data leakage before it spills over to production

Data leakage isn’t new. We’ve all heard about it. And, yes, it’s inevitable. But that’s exactly why we can’t afford to ignore it. If data leakage isn’t prevented early on, it ends up spilling over into production, where it’s not quite so easy to fix.

Data leakage in machine learning is what we call it when you accidentally gave your machine learning model the answers instead of it learning how to predict on its own. It can happen to anyone, whether because incorrect data was fed to the algorithm during training or the prediction was included in your data by mistake. Either way, if your model gets hold of data it wasn’t supposed to see during training, it can become overly optimistic, invalid, or unreliable–and will output bad predictions.  

The reality is that almost every data scientist is at risk of data leakage at some point. We all know the obvious common leakages, like including the label as one of the features or leaving the test set as part of the train set, but actually, there are many types of data leakage patterns. It may happen when you clean your data, remove outliers, separate off the test data, or during just about any other data processing. The bottom line is that when there’s data leakage, you don’t know how good the model is, and you can’t trust it to be accurate. Needless to say, if left unchecked, data leakage is much harder to fix once your model goes to production.

How to detect data leakage

Many types of data leakage are subtle, but you can ferret them out early with a few proactive strategies.

1. Check whether your results are too good to be true

If you’re seeing results that are 100% accurate, there’s clearly something wrong. But to understand what levels of accuracy should raise a data leakage flag, try to get some sort of benchmark. This might be your current performance or performance based on a very basic modeling process where you’re less likely to make mistakes. Use that baseline to see if your model’s results are in the same ballpark; they should be better but not on a different scale.

If it looks too good to be true it's probably data leakage
If it looks too good to be true, it’s probably data leakage

2. See if a single feature stands out as significantly more important than others

It’s always worth running an analysis for feature importance or correlation to understand how different features influence the decision-making process. This analysis is also a good way to capture suspicious leaks. Say your model needs to predict who should receive approval for a loan from the bank. If your analysis shows a single feature–like age–that is being used to formulate 80% of the decision, and all the other features like profession, sex, income, family status, and history make up 20%, it’s time to go back and check for leakage. Feature attribution analysis is also very effective in capturing label leakage or label proxy elements, where the predicted value was part of the features used to build the model.

Classic vs suspect feature importance

3. Get a visual to confirm the intuition behind the decision-making

If you’re using a white box algorithm that’s understandable and transparent, try to get a visualization to see how the predictions are being made. For example, if the model uses a decision tree, glance over the pattern to see if it’s odd-looking, counterintuitive, or overloaded in one area as opposed to the others. But not all models are white-box and can be followed. For your black-box models, you can use explainability methods like SHAP or LIME. These tools will run sensitivity analysis on your algorithms to explain the output and pinpoint any features that are dominating the prediction. If the predictions seem to be working but are based on things that shouldn’t carry so much weight, take another look and think about running it by a domain expert.

4. Have other practitioners do a peer code review

Having colleagues review your code is standard for software engineering but somehow isn’t a must for data science. Everyone tends to have bugs in their code, so why not in their models? Don’t be shy: organize a data science design review to go over the approach and modeling process, simulate how the algorithm runs, and catch unwanted bugs that might lead to leakage.

5. Vet that the held-out data was separated before data manipulation

When you split a dataset into testing and training, it’s vital that no data is shared between these two sets. After all, the whole idea of the test set is to simulate real-world data that the model has never seen. If you get started with data manipulations and transformations before you separate the hold-out data, there’s a good chance your data will leak. What’s more, if you find out that the hold-out data wasn’t separated at the outset, you should seriously consider starting over. Either way, check the process to see when the data was held out.  

Recognizing data leakage in production versus training

These strategies come into play while you’re training your model. Unfortunately, data leakage is still common and tends to ‘somehow’ slide over into production. This fact underlines the importance of a monitoring platform that can detect underperforming models or distribution skews as soon as the model begins working in production.  

Ready to get started with Superwise?

Head over to the Superwise platform and get started with easy, customizable, scalable, and secure model observability for free with our community edition.

Prefer a demo?

Request a demo and our team will show what Superwise can do for your ML and business. 

Recommended reading:

How to Avoid Data Leakage When Performing Data Preparation

Tutorial on how to find and fix data leakage

Overfitting vs. Data Leakage in Machine Learning

Show me the ML monitoring policy!

Model observability may begin with metric visibility, but it’s easy to get lost in a sea of metrics and dashboards without proactive monitoring to detect issues. But with so much variability in ML use cases where each may require different metrics to track, it’s challenging to get started with actionable ML monitoring. 

If you can’t see the forest for the trees, you have a serious problem.

Over the last few months, we have been collaborating with our customers and community edition users to create the first-of-its-kind model monitoring policy library for common monitors across ML use cases and industries. With our policy library, our users are able to initialize more and more complex policies rapidly, accelerating their time to value. All this is in addition to Superwise’s existing self-service policy builder that lets our users tailor customized monitoring policies based on their domain expertise and business logic. 

The deceptively simple challenge of model monitoring

On the face of things, ML monitoring comes across as a relatively straightforward task. Alert me when X starts to misbehave. But, once you take into consideration population segments, model temporality and seasonality, and the sheer volume of features that need to be monitored per use case, the scale of the challenge becomes clear.   

Superwise’s ML monitoring policy library

The key to developing our policy library was ensuring ML monitoring accuracy and robustness while enabling any customization in a few clicks. All policies come pre-configured, letting you hit the ground running and get immediate high-quality monitoring that you can customize on the fly. 

Customizable ML policies

The monitoring policy library

The policy library covers all of the typical monitoring use cases ranging from data drift to model performance and data quality. 

How to add a monitoring policy

Drift 

The drift monitor measures how different the selected data distribution is from the baseline.

Drift documentation

Model performance 

Model performance monitors significant changes in the model’s output and provides feedback as compared to the expected trends.

Model performance documentation

Activity

The Activity monitor measures your model activity level and its operational metrics, as variance often correlates with potential model issues and technical bugs.

Activity documentation

Quality

Data quality monitors enable teams to quickly detect when features, predictions, or actual data points don’t conform to what is expected.

Quality documentation

Custom

Superwise provides you with the ability to build your own custom policy based on your model’s existing metrics.

Any use case, and logic, any metic fully customizable to what’s important to you. 

Read more in our documentation

Ready to get started with Superwise?

Head over to the Superwise platform and get started with easy, customizable, scalable, and secure model observability for free with our community edition.

Prefer a demo?

Request a demo and our team will show what Superwise can do for your ML and business.

Sagify & Superwise integration

A new integration just hit the shelf! Sagify users can now integrate with the Superwise model observability platform to automatically monitor models deployed with Sagify data drift, performance degradation, data integrity, model activity, or any other customized monitoring use case.

Why Sagify?

Sagemaker is like a Swiss army knife. You get anything that you could possibly need to train and deploy ML models, but sometimes you just need a knife, and this is where Sagify comes in. Sagify is an open-source CLI tool for Sagmaker that simplifies training and deploying ML models down to two functions, train and predict. This abstracts away a lot of the low-level engineering tasks that come along with Sagemaker.

What you get with Sagify + Superwise

Now that Sagify has simplified Sagemaker training and deployment, the Sagify & Superwise integration streamlines the process of registering your new model and training baseline to Superwise’s model observability platform. This lets you hit the ground running because once you’ve initialized, you get train-deploy-monitor all in one run. Superwise will infer all relevant metrics out-of-the-box (In addition, you can also add customized metrics unique to your use case and business). This way, you don’t need to invest time in configuring model metrics. You can focus on detecting issues like drift, performance degradation, data integrity, etc., to resolve issues and improve your models faster.

Build or buy? Choosing the right strategy for your model observability

If you’re using machine learning and AI as part of your business, you need a tool that will give you visibility into the models that are in production: How is their performance? What data are they getting? Are they behaving as expected? Is there bias? Is there data drift? 

Clearly, you can’t do machine learning without a tool to monitor your models. We all know it’s a must-have tool, but until recently, most organizations had to build it themselves. It’s true that companies the size of Uber can build a solution like Michelangelo. But for most companies, building a monitoring platform can quickly transition into something kludgy and complex. In the article understanding ML monitoring debt, we wrote about how monitoring needs have a tendency to scale at warp speed and you’re likely to find that your home-grown limited solution is simply not good enough.

This article will help you with some of the key advantages of using a best-of-breed model observability platform like Superwise versus building it yourself.

Let’s compareBuildBuy
Time to value1 – 2 years for MVP.1 day
Required effort3 – 5 data scientists and machine learning engineers to build MVP for 2 years.1 engineer to integrate with Superwise.
Total cost of ownership30% of DS and MLE time to maintain and adjust a limited solution and react to ongoing business issues through troubleshooting.Easily expands for new use cases and accommodates maintenance, upgrades, patches, and industry best practices.
StandardizationNone.
Different DS and MLE teams can use different tools, metrics, or practices to measure drift, performance, and model quality.
Built-in.
Multiple teams can work on different ML stacks and use one standard method for measurements and monitoring.
One source of truthDifferent roles use diverse dashboards and measurements for the same use case: DS, MLE, business analyst.Different roles get alerts and notifications on different channels but all from the same source of truth.

Time to value

The common approach to traditional software is:  if there’s an off-the-shelf solution that answers your needs, don’t waste time having your developers build one and get into technical debt. After all, building is not just about creating the tool. It involves personnel requirements, maintenance, opportunity cost, and time to value—not to mention quality assurance, patch fixes, platform migrations, and more. Face it, you want your team to be busy using their expertise to advance your company’s core business.  

Required effort

As data scientists and engineers, we love to create technology that solves problems. It’s very tempting to say, ‘hey, let’s do it ourselves, and it’ll have exactly what we want’, especially in a startup environment. If your solution supports diverse scenarios and use cases, you’ll need to customize each one. And that means a lot of extra work. When you use ML for many different use cases, you need a single tool that can handle all the scenarios—present and future—and doesn’t need to be tweaked or customized for each one. Is it really practical to invest hours of your best experts’ time to design and build a solution if one already exists and has been proven in the market? It’s worth seeking out a vendor that has already solved the problem, perfected their solution, and rounded up all the best practices in the area of monitoring.

TCO

A tool that can monitor your machine learning models’ behavior is a system like any other that you develop. It needs to be maintained and upgraded to offer visibility for new features, additional use cases, and fresh technology. As time passes, the TCO of a monitoring tool will begin to grow, requiring more maintenance, additional expertise, and time for troubleshooting. Ask yourself if this will be the best investment of your resources. 

Standardization

Will your monitoring work when there are multiple teams depending on the same tool? Everyone has different needs for how to track, what to track, and how to visualize the data. If you find the right tool ready-made, you’ll be starting off with one single source of truth that meets everyone’s needs. It’s critical to have a dedicated tool that can handle all the monitoring needs of all the teams involved to ensure they are synchronized and work with standardized measurements.  

One source of truth

MLOps is not just about putting the right tools in place. It’s about establishing one common language and standard processes: when to retrain, how to roll out a new version to production, how to define SLA on model issues, and more. To make this happen, you need to first initiate a central method to collect, measure, and monitor all the relevant pieces of information.

Meme showing common ML failure reactions without observability

Just a few short years ago, there simply was no option to buy ready-made tools that could monitor your AI models in production. We didn’t think about whether it was worth the cost of buying them or if it was the right thing to do. We simply went and built it. Happily, today, there are so many amazing things we can take off the shelf, and you should not have to sacrifice the features you need. 

At Superwise, we spent the last two years building a monitoring solution that is adaptable, super-customizable, expandable – and always growing. It can handle what you need for now and the future without you having to invest time and effort to build, troubleshoot, and maintain your own monitoring system.

Ready to get started with Superwise?

Head over to the Superwise platform and get started with easy, customizable, scalable, and secure model observability for free with our community edition.

Prefer a demo?

Request a demo and our team will show what Superwise can do for your ML and business.

Say hello, SaaS model observability 

I’m thrilled to announce that as of today, the Superwise model observability platform has gone fully SaaS. The platform is open for all practitioners regardless of industry and use case and supports any type of deployment to keep your data secure. Everyone gets 3 models for free under our community edition. No limited-time offers, no feature lockouts—real production-ready model observability. 

Head over to the platform now to sign up, integrate your models 

What drives us

Since the day that we started Superwise, we’ve worked closely with our customers to realize our mission of making model observability accessible to anyone. A SaaS platform that will end the need for years-long ML infrastructure and tooling integration projects without compromising an inch on self-service customization and security.

What guides us

There are four core values that resonate throughout the platform and everything we do for our customers.

Make it easy 

Easy to start. Easy to integrate. Easy to see value.

Model observability should be as easy and as obvious a choice as traditional software monitoring. That’s why Superwise is model and platform agnostic, comes with a host of plugins and an SDK, is API-first, and, last but not least, lets you sign up and start on your own. 

Make it customizable 

Custom metrics. Custom monitoring. Custom workflows.

You’re the ones that know your models and business the best. From issues you need to know about, such as bias, drift, and performance. To the workflows you need to build around issues, what domain knowledge and business KPIs need to be incorporated into ML decision-making processes, and how to best alert and empower your teams to resolve issues faster.

Make it secure 

Lightweight, secure, flexible deployments. Data doesn’t leave your organization.

We totally get it. Your data and models are sensitive, and data science and ML engineering teams shouldn’t need to install or manage complex infrastructure to support their observability needs. Whatever your deployment needs, be it pure SaaS or self-hosted, you have control to ensure that no raw data or plain values will ever leave your network. 

Make it scalable

Scalable technology. Scalable automation. Scalable pricing.

You scale, we scale. It’s that simple. Superwise is built for scale and works just as well on 1,000 models as it does on 1. To drive scale, automation is required, from embedded anomaly detection to reduce the tedious efforts of searching for anomalies. All the way up to an open platform approach that enables interaction with Superwise metrics and incidents via APIs. No less importantly, our pricing is flexible and gives you complete control over how and when you scale up or down. 

What’s next?

As awesome of a day today is for us, we’re just getting in gear. Obviously, we’re obsessed with creating a truly streamlined model observability experience that can be customized to any ML use case and that our users love. But for all our roadmap and plans, it’s not about us. How do you use Superwise? What do you love and wish to see? What’s not good enough, and what do you need to close the loop and streamline model observability?

How? Email me at oren.razon@rebrandstg.superwise.ai, chat with us in-app, DM us. Whatever works for you, we’re here and would love to chat.